Task 1 of the IELTS Academic Writing Test asks students to assess and explain visual material such as pie charts, bar graphs, and tables. Effective communication and proper word use are critical for presenting material effectively. Candidates must have the relevant vocabulary repertoire to successfully explain proportions, comparisons, and trends when using pie charts. Mastering the terminology and structure for explaining pie charts may greatly improve a candidate's performance and raise their chances of receiving a better band score. This tutorial aims to give IELTS candidates a thorough comprehension of the necessary language as well as step-by-step tactics for constructing their replies while completing pie chart exercises. By following the procedures mentioned and using appropriate terminology, candidates may tackle pie charts in IELTS with confidence and clearly convey their thinking, thereby boosting their overall IELTS writing skills.
Introduction
Understanding the Marking Criteria
The IELTS Writing Task 1 assesses candidates on four critical criteria: The IELTS Writing Task 1 assesses candidates on four crucial criteria:
-
Grammatical Range and Accuracy
Under this criterion, the candidate's competence in using grammatical structures correctly is assessed, including the correct usage of tenses, sentence patterns, punctuation, and the formation of simple and compound sentences. Candidates should show knowledge of grammatical rules and commit no grammatical mistakes.
-
Task Achievement
Task Achievement is about how well the candidate addresses the task requirements by providing a practical summary of the material presented, emphasising essential features and creating a logically structured answer. Candidates must cover all the issues related to the task and provide a cohesive response.
-
Lexical Resource
Lexical Resource accesses the vocabulary range, accuracy, and appropriateness of the candidate’s vocabulary. The candidates must demonstrate their broad knowledge of vocabulary, synonyms, collocations, and idiomatic expressions. There should be precise and descriptive language that conveys meaning efficiently.
-
Coherence & Cohesion
Coherence & Cohesion refers to the overall clarity and organisation of the writing. Candidates should use linking words and phrases logically to connect ideas. Good paraphrasing skills and coherence within and between paragraphs is expected. The essay structure should be logical and easy to follow. If you still need clarification regarding the marking criteria, you can contact the Yocket counsellors, who are always there for help.
IELTS Pie Chart Task 1 Vocabulary
Percentage to Fractions
These are IELTS Pie Chart Task 1 Vocabulary: Percentage to Fractions
|
Percentage |
Fraction |
|
5% |
One in twenty |
|
10% |
One in ten |
|
15% |
Less than a fifth |
|
20% |
A fifth |
|
25% |
A quarter |
|
30% |
Less than a third |
|
35% |
More than a third |
|
40% |
Two fifths |
|
45% |
More than two-fifths |
|
50% |
Half |
|
55% |
More than half |
|
60% |
Three fifths |
|
65% |
Two thirds |
|
70% |
Seven in ten |
|
75% |
Three-quarters |
|
80% |
Four-fifths |
Percentage to Qualifiers
These are IELTS Pie Chart Task 1 Vocabulary: Percentage to Qualifiers
|
Percentage |
Qualifier |
|
32% |
Almost a third |
|
49% |
Nearly a half/just under a half |
|
77% |
Approximately three quarters/just over three quarters |
Percentages to Other Phrases
These are IELTS Pie Chart Task 1 Vocabulary: Percentages to Other Phrases
|
Percentage |
Proportion/Numbers/Amount/Majority/Minority |
|
5% |
A minimal number |
|
10%-15% |
A minority |
|
65%-75% |
A significant proportion |
|
75%-85% |
A vast majority |


How do you organise your writing assignment in one pie chart?
In Pie Chart Assignment 1, you will learn how to correctly build your pie chart explanation to succeed. The responses and the proper terminology must be sequenced to get a high band score on the writing activity.
Step 1: Prepare.
- Select and report the pie chart's primary elements. Under the IELTS pie chart graphic, write about what the pie chart depicts and any associated synonyms.
- Determine the most significant and most minor parts of the pie chart. Also, grasp what it symbolises and the proportion.
- Make a note of the dates, periods, and announcements.
- The goal is to summarise, so seek the overall picture rather than getting buried in the minutiae.
Step 2: Divide everything you've discovered into two categories.
When dividing the material into two categories, focus on the following topics.
- Major trends.
- Major groupings.
- Exceptions.
- Group Information.
- Other related concepts.
This phase aims to arrange the primary groupings in your thoughts, allowing you to express all of your essay's critical trends, similarities, and changes. It also teaches you to create a pie chart in IELTS essay in a clear and integrated manner. Remember that Coherence and Cohesion are one of the writing assignment 1 band characteristics, accounting for 25% of your total band score.
Step 3: Organize your paragraphs.
You must first understand how to compose paragraphs and arrange ideas to get a high band score on IELTS academic writing assignment 1. Structure your essay into the following sections: Paragraphs one, two, three, and four. Read the following ideas to figure out what to write in each area.
Writing Task 1: Sample Answer
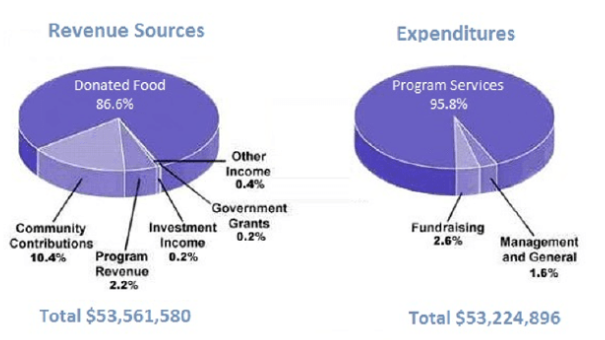
The pie chart depicts the amount of money spent and received by a children's charity in the United States during a single year.
Summarise the information by choosing and reporting the key elements and draw comparisons where appropriate.
Write at least 150 words.
Writing Task 1: Sample Answer
The pie chart depicts the income streams and expenditures for a one-year children's charity organisation in the United States.
Donated food accounted for the vast bulk of the $53,561,580 in income. Community donations are the second largest source of income, accounting for around 10.4%. The remainder is relatively tiny, including program revenue, investment income, and government grants.
Children's charities have spent significantly on program services, accounting for 95.8%. Other costs include fundraising, management, and general, totalling $53,224,896. There are more income streams than expenditures.
The children's charity generated around $53,561,580 in income and spent $53,224,896. A significant sum of money came from donated food. In addition, 95.8% of the budget was spent on program services.
Writing Task 2: Sample Answer
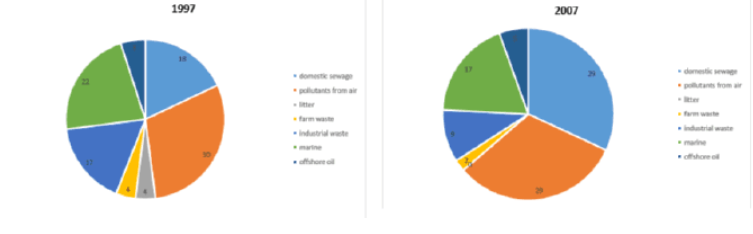
The two pie charts depict the proportion of contaminants entering a specific section of the ocean between 1997 and 2007. Summarise the information by choosing and reporting the most critical elements and draw comparisons where appropriate.
Write at least 150 words.
Two pie charts depict the proportion of contaminants in Model Essay 1.
In 1997, most pollutants entering the ocean originated from the air, accounting for 30%. However, in 2007, pollutants from the air and residential sewage were the primary sources of pollution.
1997, air and marine pollutants were the two most common pollution causes. Marine pollution accounted for 22%, while household sewage comprised 18%. Litter and agriculture waste were the most minor polluting sources, accounting for the same amount (4%). Other sources of ocean pollution include industrial waste and offshore oil.
In 2007, home sewage and air pollution together created 29 per cent. Compared to pie chart data from 1997, the proportion of residential sewage grew while marine contaminants dropped—the least amount of harm to the ocean from agricultural waste.
If you want more sample questions and answers, you can contact yocket counsellors for a customised study plan for your IELTS preparation.
Two pie charts depict the proportion of contaminants in Model Essay 2.
The two pie charts represent the numerous sources of pollution that reached a particular ocean area during two years.
The primary source of pollution in 1997 was air pollution. However, in 2007, air pollutants and residential sewage were the leading causes of ocean contamination. Litter and agricultural waste were the most minor pollution sources in 1997, although farm waste accounted for a small amount in 2007.
Air pollution were responsible for 30% of ocean degradation. Marine pollution was the second leading source of contamination in the ocean, accounting for 22%. Industrial waste and home sewage had virtually exact percentages (17 and 18). Litter, agricultural waste, and offshore oil were other significant pollution causes.
Domestic sewage and air pollutants were the leading causes of pollution in 2007. It should be emphasised that both contributed 29 per cent of the pollution issue. Marine pollution causes 17 percent of the contamination. According to the pie chart statistics, agriculture waste has not impacted the ocean the most.
Suggested: Latest IELTS Writing Topics and Questions
Tips for Describing Percentages Effectively in IELTS Writing Task 1
Describing and analysing percentages accurately is essential for achieving a high score in IELTS Writing Task 1. Candidates should utilise varied vocabulary, sentence structures, and linking words to convey trends and comparisons in the data.
Tip 1: Using Precise Verbs
- Utilise succinct verbs such as “increase”, “decrease”, “fluctuate”, and “plummet” to characterise percentage changes.
- The verbs like "go", "ascend", and "descend", as well as "fall" and "drop", will make more variety.
Tip 2: Quantifying the Changes
- Choose words like "considerable", "slight", "marginal", and "drastic" to qualify the percentages.
- Use percentages for clarity, for instance, "5% increase".
Tip 3: Making Comparisons
- Compare percentages using structures like “higher/lower than”, “twice as much as”, and “three times as many as”.
- Show both perspectives, including the highest and lowest points.
Tip 4: Linking Ideas Logically
- Use conjunctive words such as "whereas", "while", "despite", and "in order to" to create logical connections.
- Summarise the trends as a whole in the end.
By utilising a vast array of exact vocabulary and sentence structures, the candidates can demonstrate different approaches to analysing percentages, allowing them to score a high band.
Conclusion
Mastering the IELTS Writing Task 1 pie chart will be effortless with Yocket. Our app provides everything you need to excel at describing data - expert lessons to build your skills, top-scoring sample essays to model, and constant practice with detailed feedback. Yocket goes beyond prep materials with one-on-one tutoring, ensuring you receive customised guidance. Thousands of students have achieved their target IELTS band score using our proven training. Download the Yocket website to start honing your pie chart essay today! With the proper preparation, you will adeptly analyse and articulate key data trends on test day.

Comments on Pie Chart Writing Task 1 Sample Answer