The bar chart in IELTS is one of the most prevalent challenges test-takers face in the vast ocean of IELTS exam problems. Understanding and explaining a bar chart well is vital for getting a high band score on Academic Writing Task 1. We'll go on a trip to comprehend the subtleties of an IELTS bar chart in this blog and arm ourselves with the knowledge and abilities needed to complete this work effectively.
Table of Content
What is IELTS Bar Graph Writing Task?
In the IELTS Academic Writing Task 1, candidates may encounter a task that involves interpreting and describing a bar chart graph. This task typically presents a visual representation of data in the form of one or more bar charts, where the length of bars represents quantities or values.
Candidates are required to analyze the information presented in the chart(s) and provide a written response, summarizing the key trends, comparisons, and significant details. The objective is to showcase the ability to understand and convey information from visual data accurately.
Key tips for tackling IELTS bar chart graph tasks include:
- Introduction: Begin with a brief introduction that outlines the main features of the graph(s) and provides context.
- Overview: Include a paragraph that summarizes the main trends or patterns observed in the chart(s). This provides a quick snapshot for the reader.
- Specific Details: In subsequent paragraphs, delve into specific details, making comparisons and highlighting significant data points.
- Language and Structure: Use a variety of vocabulary to describe trends (e.g., increase, decrease, fluctuate) and appropriate sentence structures. Ensure coherence and cohesion in your writing.
- Units and Values: Pay attention to units (e.g., percentages, numbers) and accurately convey the values represented in the chart(s).
- Conclusion: Conclude your response by summarizing the key points and trends without introducing new information.
Practicing with sample bar chart graph tasks and reviewing model answers can be beneficial for candidates preparing for the IELTS Academic Writing Task 1.
Elements of a Bar Chart in IELTS
Title
Each bar chart has a title that describes the graph's primary topic and gives some background information. The main characteristics being compared are sometimes included in the title while discussing the IELTS.
Axes and Labels
The horizontal (x-axis) and vertical (y-axis) axes are the two that make up bar charts. The x-axis indicates categories or time, while the y-axis shows the numerical data. These axes' labels are necessary to interpret the data correctly.
Bars
The data is represented visually by the bars in a bar chart. Every bar represents a particular group or category, and its length reveals the size of the value it stands for.
To further simplify your dream of studying abroad, try using Yocket’s intelligent features.
IELTS Bar Graph Description
After going over the essential components of a bar chart in IELTS, let's examine a systematic way to describe one in the IELTS Academic Writing Task 1
Introduction
The introduction should start with a summary of the data presented in the graph, paraphrasing its title. This introduces the reader to the chart and shows that you understand its key components.
Overview
Completing the overview part is essential to achieving the IELTS job. Briefly summarise the chart's central themes, patterns, or noteworthy elements. Avoid focusing on individual data points and instead concentrate on the most critical information.
Body Paragraphs
Give each significant trend or characteristic mentioned in the overview paragraph. Introduce the vital idea first, then provide evidence to support it. Finally, wrap up with a statement summarising everything that has been said. To convey patterns, use a range of language, such as "increase," "decrease," "fluctuate," or "remain constant."
Language and Grammar
Provide a range of grammar structures and vocabulary. However, you need to avoid using the exact words and phrases repeatedly so that your English should be impeccable. Remember the use of superlatives, comparatives, and verb tenses.
Data Accuracy
Verify that the information you've provided in your description corresponds to the data shown in the bar chart. Employ precise figures and percentages to enhance the accuracy of your study. Recheck your numbers to make sure there are no errors.
Conclusion
Summarise the main ideas in your body paragraphs and reiterate the general pattern or trend. Based on the facts provided, you can give a forecast or remark on potential future developments.
To sum up, being an expert at expressing a bar chart in IELTS requires a systematic strategy that includes an overview, an introduction, body paragraphs, linguistic competency, correct facts, and a brief conclusion. Practicing these techniques can help test-takers sail through the IELTS waters confidently and increase their chances of receiving a high band score on Academic Writing Task 1. Have fun with your charting!
Explore Destinations
Explore All Guides 


IELTS Bar Chart Sample Question & Answer
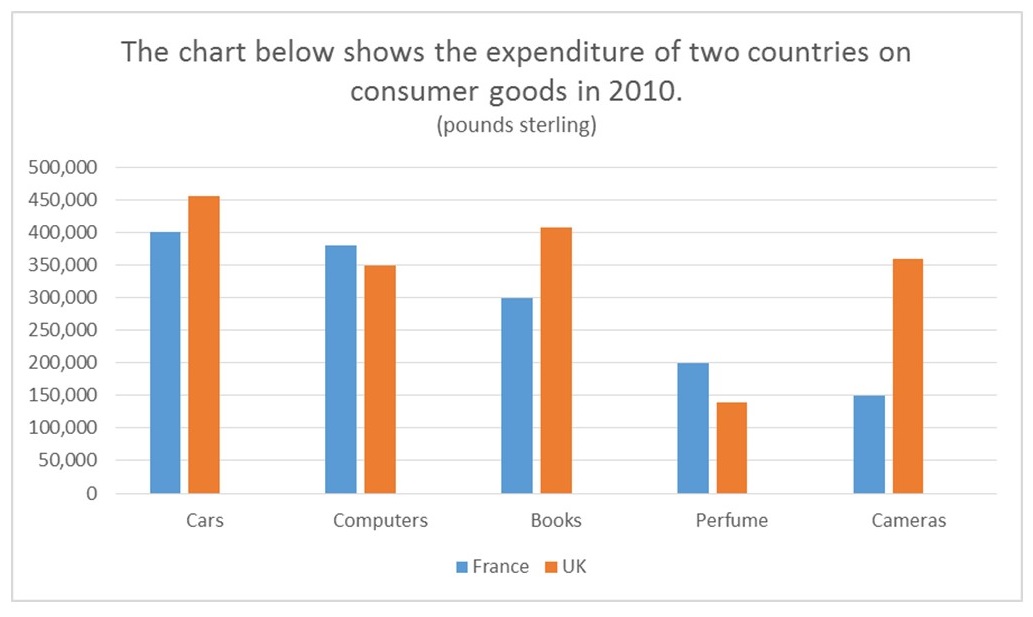
Question 1. The hart below shows the expenditure of two countries on consumer good in 2010. Summarise the information by selecting and reporting the main features, and make comparisons where relevant. Write at least 150 words.
IELTS Bar Chart Sample Answer
The chart depicts the expenditure on five consumer goods (cars, computers, books, perfume, and cameras) in France and the UK in 2010, measured in pounds sterling. Notably, the UK outspent France overall, with both nations allocating the majority of funds to cars. However, the UK's lowest spending was on perfume, whereas France allocated the least to cameras. The most significant spending disparity was on cameras.
In terms of cars, the UK spent approximately £450,000 compared to France's £400,000. British expenditure on books (around £400,000) also surpassed that of the French (£300,000). The UK's camera expenditure (just over £350,000) was more than double France's (£150,000).
Conversely, France surpassed the UK in spending on remaining goods. French spending on computers exceeded £350,000, slightly more than the UK's exact £350,000. Both nations allocated minimal funds to perfume, with £200,000 in France and under £150,000 in the UK.
From the Desk of Yocket
In summary, one needs to have a systematic approach to understand how best the bar chart in IELTS is read and described. Such an understanding would need factors such as well-written topic sentences regarding the introduction and overview of all body paragraphs within the text, which should be organised articulately using various techniques locally used by academicians before it can finally ensure proper marking out. If test-takers meticulously follow these strategies, they will be able to overcome the difficulties of IELTS Academic Writing Task 1 with ease and substantially improve their likelihood of receiving a high band score.
As you set out to conquer the IELTS, remember that preparation and practice are essential. To further simplify your dream of studying abroad, try using Yocket’s intelligent features. Yocket makes your study abroad needs easier with its advanced tools and resources. Embrace your new academic journey confidently and discover the world of possibilities. Visit Yocket today and enjoy an easy, all-inclusive study abroad journey!