SAT Scoring Report: Range, Subscores, Cross-Test Scores & Chart
Have you ever stopped to wonder how your performance on the SAT actually translates into a score?
If you’re scratching your head about the SAT scoring, you’re not alone. This blog is here to guide you through the process, step-by-step, and equip you with the knowledge to interpret your SAT score report with confidence. We’ll also provide you with helpful score charts to see where you stand and what your next steps might be.

What is the SAT Score Range?
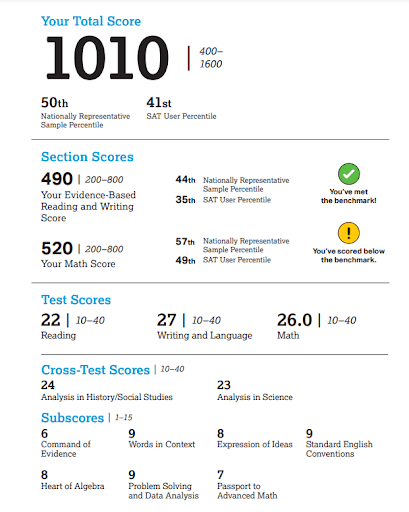
Your total SAT score ranges from 400 to 1600. This total is calculated by adding your scores on two main sections: Evidence-Based Reading and Writing (EBRW), and Math. Each section is scored on a scale of 200–800.
The EBRW score combines your performance on the Reading Test and the Writing and Language Test, with each test contributing equally to the section’s total. In contrast, the Math section score solely reflects your performance on the dedicated Math Test.
How are the Section Scores on the SAT Calculated?
Your performance in each section determines your section score, which is directly linked to your raw score: the number of questions you answered correctly. However, the SAT accounts for varying difficulty levels across different test versions by converting raw scores to a scaled score range of 200 to 800. This “equating” process ensures scores on different versions are comparable.
For instance, in the Math Test (containing 58 questions), a raw score of 57 might earn you a perfect 800 on one version, while you might need all 58 correct on another. This ensures that, regardless of test difficulty, a consistent scaled score reflects the same level of mastery in each section.
How is the Overall SAT Score Calculated?
Each individual test score you receive on the SAT, be it for Reading, Writing and Language, or Math, falls within a range of 10 to 40. This scaled score is derived by converting your raw score (the number of questions you answered correctly) to account for slight variations in test difficulty between different versions.
For the Evidence-Based Reading and Writing section score, your individual Reading and Writing and Language test scores (also scaled between 10 and 40) are each multiplied by 10 and then added together. This combined score represents your overall proficiency in these areas.
Similarly, your Math section score is calculated by multiplying your individual Math test score (scaled between 10 and 40) by 20. This reflects your mastery of the mathematical concepts covered in the exam.
Read Also: How to Calculate SAT Score: Explore SAT Raw Score Conversion
What are the Subscores in the SAT?
The SAT exam includes seven subscores, each ranging from 1 to 15, offering a deeper understanding of your performance beyond the total score. These subscores target specific skill sets within the test’s three main sections: Reading, Writing & Language, and Math.
While the number of questions contributing to each subscore varies (for instance, 19 for Heart of Algebra and 16 for Passport to Advanced Math), raw scores are scaled to ensure a consistent 1–15 range for fair comparison.
What are the Cross-Test Scores in the SAT?
Your SAT score report includes two additional scores called cross-test scores: Analysis in Science and Analysis in History/Social Studies. These scores aren’t based solely on your performance in one section but rather assess your ability to apply analytical skills across all three SAT sections (Reading, Writing and Language, and Math).
A total of 35 questions contribute to each cross-test score: 21 from Reading, 6 from Writing and Language, and 8 from Math. Your raw score on these questions (ranging from 1 to 35) is then converted to a scaled score between 10 and 40. This provides valuable insight into your strengths and weaknesses in applying analytical skills to different subject areas.
Take a look at this sample scorecard from the College Board, which breaks down the different scoring components of the SAT.

What About the SAT Essay?
Two trained readers carefully evaluate your optional SAT Essay using a detailed scoring system. Your essay is assessed in three key areas: reading comprehension, analysis of evidence, and writing skills.
Each area receives a score between 2 and 8, based on the combined evaluations of the two readers. There is no single composite score for the SAT Essay, and percentiles are not reported. To ensure consistent and fair evaluations, all scorers are rigorously trained to apply the same high standards outlined on this page.
Note: The SAT Essay is no longer offered as a general option, but it remains available for some of our state partners who require the essay as part of SAT School Day administrations.
SAT Score Chart
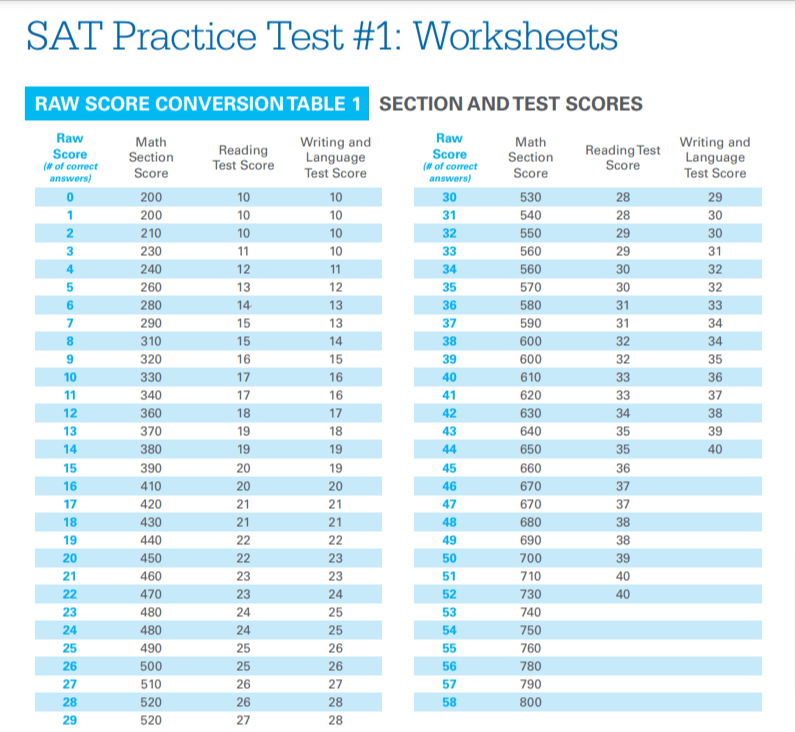
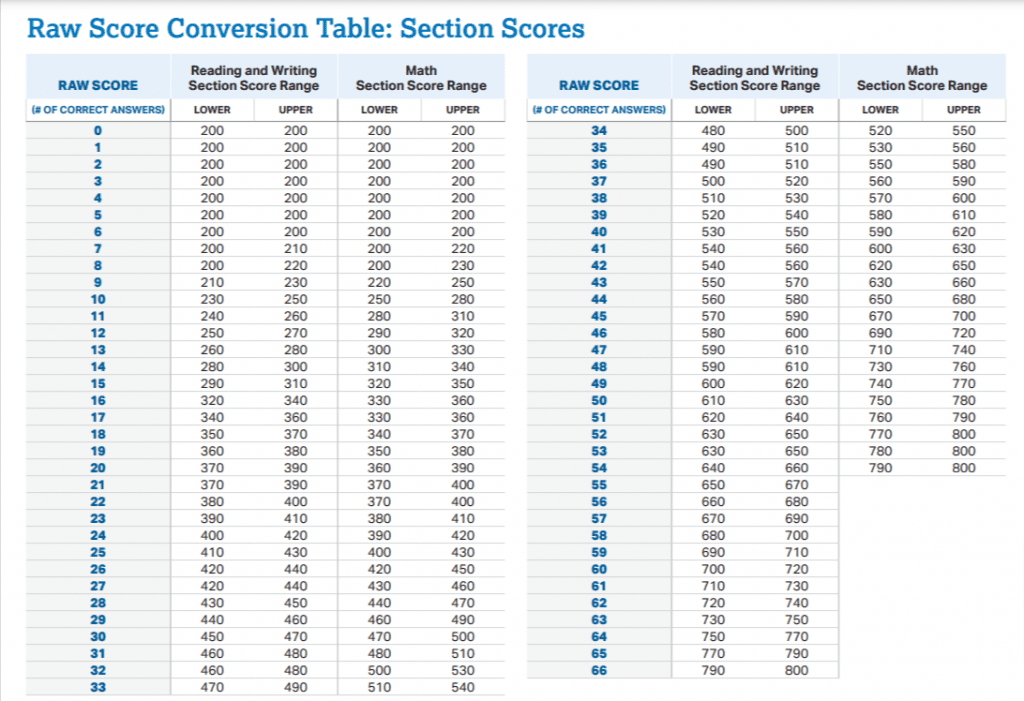
Although the College Board hasn’t released confirmed score range tables for the redesigned SAT yet, the raw-to-scaled score tables from their free practice tests offer an insightful preview of how scores are converted.

Score Conversion Table: Test 1

Score Conversion Table: Test 4
While the tables look similar, you’ll notice slight differences in scoring. For instance, a raw score of 57 earns you a perfect 800 on Test 4, but not on Test 1. This is because, as mentioned, each test is equated. Despite varying difficulty, an 800 on any test represents the same level of mastery. The slightly harder Math section on Test 4 simply allows one more point for error while still achieving an 800.
Suggested: SAT Score Conversion Chart: Old vs. New
From the Desk of Yocket
The SAT’s scoring system aims for objectivity and consistency. Scores are based on the number of correct answers, providing a seemingly clear metric for comparing students’ performance. The College Board, which administers the SAT, has made some changes to the test in recent years. For example, the essay portion is now optional, and the math section now includes a calculator-permitted portion.
This scoring method provides a common yardstick for comparing students from diverse backgrounds and educational experiences. This can be appealing to colleges seeking a standardized measure for making admissions decisions. The current system also assesses your critical thinking skills, reading comprehension, and the ability to apply knowledge in unfamiliar contexts, all valuable skills for college success. Additionally, the emphasis on multiple-choice questions allows for efficient grading and reduces potential bias from graders. Yocket can further assist students in understanding and leveraging these assessment mechanisms for effective SAT preparation and college admissions.
Frequently Asked Questions
How is the SAT scored?
Each section on the SAT is scored from 200 to 800, based on the number of correct answers and the difficulty of the questions. The total score is the sum of the two section scores.
What is the average SAT score?
The College Board reports that the average SAT score in 2023 was 1028 (520 EBRW + 508 Math). However, averages can vary based on factors like demographics and college aspirations.
How can I interpret my SAT score on the score chart?
The SAT score chart tells you how many questions you answered correctly and how your score compares to other test-takers. You can also use it to see how your scores fall within the scoring ranges for different colleges.
